
Ready to transform your business with Data Analytics?
Contact our expert team today for a tailored strategy and free consultation.
Get a Free ConsultationNo services available in this category yet.
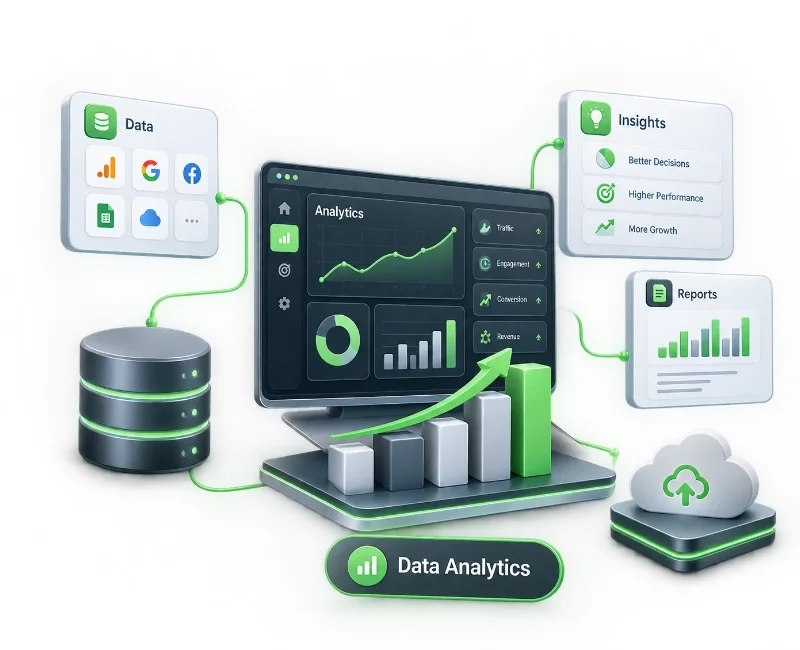
Your business already generates valuable data across websites, campaigns, sales systems, customer interactions and digital platforms. The challenge is turning that information into something your team can actually use.
Falconics helps businesses bring performance data into focus through analytics, reporting, dashboards, tracking and conversion analysis. Instead of relying on disconnected numbers, you get a clearer view of what is happening, why it is happening and where attention is needed.
Whether you need better reporting, marketing analytics, customer insights or a more structured measurement system, our approach starts with your business objectives rather than a fixed analytics package.
Key areas we can support:
Business and performance analytics
Analytics dashboards and reporting
Website and marketing tracking
Customer and conversion analysis
Data is only valuable when it helps someone make a better decision.
Our data analytics services connect the measurement side of your business with the decisions that follow. We examine the information available to your organisation, identify meaningful patterns and present the findings in a way that business and marketing teams can understand.
For a growing business, this may mean understanding which acquisition channels are producing meaningful outcomes. For an established organisation, it may involve bringing information from different systems into a clearer reporting environment.
The objective is not to produce more reports. It is to make important business information easier to access, interpret and act upon.
Falconics provides analytics capabilities around the areas that matter most to your business. The exact scope can be adapted according to your data environment, objectives and existing technology.
We organise business information into meaningful performance views so decision-makers can identify trends, gaps and opportunities without working through disconnected spreadsheets or reports.
This can include KPI analysis, performance monitoring, business reporting and visualisation of important operational or commercial metrics.
A useful dashboard should answer business questions, not simply display numbers.
We can structure dashboards around the metrics your teams actually need to monitor, creating clearer views of performance across marketing, sales, ecommerce or other relevant functions.
Reporting can be designed for regular management reviews as well as more detailed operational analysis.
Digital businesses generate data from multiple touchpoints. Analytics can help connect website activity, campaigns, user behaviour and conversions to understand what is contributing to performance.
Falconics can work with areas such as GA4, Google Tag Manager, conversion tracking, campaign measurement, heatmap analysis and CRO reporting where relevant to the project.
Understanding what customers do is often more useful than simply knowing how many customers you have.
We analyse available behavioural and performance data to help identify patterns such as user journeys, engagement differences, conversion friction and customer segments.
These insights can support decisions around marketing, website experience, offers and customer acquisition.
Traffic alone does not explain business performance.
Conversion analysis looks more closely at what happens after users arrive — where they engage, where they leave, which actions matter and where the experience may be creating unnecessary friction.
The resulting insights can help prioritise practical improvements rather than relying on assumptions.
When business information exists across multiple platforms, consistent measurement becomes difficult.
Where required, analytics projects can involve connecting relevant data sources, standardising important metrics and establishing a more reliable measurement framework.
The focus is on creating a usable foundation for reporting rather than adding technology without a clear business purpose.
The value of analytics depends on what you do with the information. A well-structured analytics system can help your team:
Understand performance across important business channels
Identify trends and changes earlier
Find weaknesses in customer and conversion journeys
Compare performance against relevant KPIs
Reduce reliance on assumptions when making decisions
Give different teams access to a clearer view of business performance
For example, an ecommerce business may use analytics to understand where customers abandon the purchase journey, while a B2B company may focus more heavily on lead quality, funnel movement and acquisition performance.
The right measurement framework depends on the business model.
A successful analytics project starts with understanding the questions the business needs answered.
1. Business & Data Discovery
We first understand your objectives, existing systems, available data and the decisions you want analytics to support.
2. Measurement Planning
We identify the relevant KPIs, events, data sources and reporting requirements. This creates a clearer definition of what needs to be measured and why.
3. Data Preparation
Where necessary, information is reviewed, structured and prepared so that reporting is based on consistent and usable data.
4. Analytics & Visualisation
Relevant data is analysed and presented through appropriate reports, dashboards or analytical views. The emphasis is on making important patterns understandable.
5. Review & Optimisation
Analytics should evolve as your business changes. We review performance information and identify areas where tracking, reporting or conversion processes can be improved.
Depending on the project scope, your analytics engagement may include:
| Area | Potential Deliverables |
|---|---|
| Measurement | KPI framework, event tracking and measurement planning |
| Reporting | Performance reports and management reporting |
| Dashboards | Custom analytics dashboards and visual performance views |
| Website analytics | GA4, Tag Manager and relevant tracking configuration |
| CRO | Conversion analysis, heatmap insights and funnel analysis |
| Business intelligence | KPI analysis, trend identification and business performance views |
| Ongoing optimisation | Reporting reviews and recommendations based on performance data |
The final deliverables are determined by your requirements rather than a one-size-fits-all package.
Data analytics can be valuable at different stages of business maturity.
Startups and growing businesses can establish the right measurement foundation before data becomes fragmented across multiple platforms.
SMEs and established businesses can consolidate performance information and make reporting more useful for management decisions.
Ecommerce businesses can analyse customer journeys, acquisition channels, product performance and conversion behaviour.
B2B companies can use analytics to understand lead sources, funnel performance, campaign contribution and customer engagement.
Marketing teams can connect campaign activity with measurable outcomes and identify where optimisation should be prioritised.
Many businesses do not have a shortage of data. They have a shortage of clarity.
Typical challenges include disconnected reporting, inconsistent KPIs, incomplete website tracking, unclear conversion paths, manually prepared reports and difficulty identifying which numbers actually matter.
The solution is not always a new analytics platform. Sometimes the greater need is a better measurement structure, cleaner reporting or a clearer connection between data and business objectives.
Falconics approaches each project around that underlying requirement.
Falconics brings analytics together with digital marketing, technology, web development, AI and business growth capabilities. That wider technical context can be useful when analytics requirements overlap with websites, marketing campaigns, ecommerce systems, software or automation.
Our working approach is structured around understanding the business first, defining the measurement requirements, implementing the relevant solution and then using performance information for continuous improvement.
You also have the option to work with one technology and digital partner when an analytics project needs to connect with other parts of your digital ecosystem.
Analytics projects may involve technologies appropriate to your existing environment, including Google Analytics 4, Google Tag Manager, reporting platforms, databases, cloud technologies and other business systems.
The technology is selected according to the measurement requirement. The aim is to avoid unnecessary complexity and build an analytics environment that your team can actually use.
Analytics does not automatically produce business improvements. The quality of the underlying data, tracking setup, available systems, business objectives and ability to act on findings all influence the value of the engagement.
Meaningful analysis also requires context. A sudden change in traffic, sales or conversions may have several possible causes, so analytics should be interpreted alongside business activity rather than viewed as isolated numbers.
Falconics focuses on making the information understandable and useful so your team can make informed decisions from it.
There is no single price for a data analytics project because the scope can vary significantly between businesses.
Pricing may depend on factors such as:
Number and complexity of data sources
Tracking and integration requirements
Dashboard and reporting scope
Existing analytics infrastructure
Number of websites, products or business units involved
Level of ongoing analysis and support
After understanding your requirements, the engagement can be scoped around the actual work required rather than an arbitrary package.
Data analytics is the process of examining business data to identify useful patterns, trends, relationships and performance insights. Businesses can use those insights to understand what is happening and make better-informed decisions.
It can include measurement planning, data analysis, dashboards, reporting, website and marketing analytics, conversion analysis, data integration and ongoing performance reviews. The exact scope depends on the business requirement.
Yes. An analytics project can start with an existing setup rather than requiring everything to be rebuilt. We can assess the current measurement environment and identify areas that need improvement.
Analytics implementations can include GA4 and Google Tag Manager configuration where these tools are appropriate for the project. Tracking requirements are defined around the events and KPIs the business needs to measure.
Analytics can identify where users engage, drop off or encounter friction in a conversion journey. Those insights can then inform CRO and website improvements, although specific performance outcomes cannot be guaranteed.
Yes. Dashboards can be structured around the KPIs and reporting requirements that matter to your business rather than using a generic set of metrics.
Yes. Analytics can be designed for businesses with relatively simple data environments as well as organisations with more complex reporting and integration requirements.
The timeline depends on the number of data sources, technical complexity, tracking requirements, reporting scope and the condition of the existing data environment. A project timeline can be defined after the requirements are reviewed.
Depending on the project, access may be required to relevant analytics platforms, websites, advertising accounts, databases or other business systems. The specific access requirements are established during project discovery.
Ongoing reporting, monitoring, analysis and optimisation can be included when required. The level of support depends on the business's reporting and analytics needs.
Start with a discussion about your business objectives, existing data sources and the decisions you want analytics to support. From there, the project scope and appropriate analytics approach can be defined.
Better analytics starts with asking the right questions.
If your business has data across multiple platforms but lacks a clear way to turn it into useful business insight, Falconics can help you establish a more structured approach to measurement, reporting and analysis.
Contact our expert team today for a tailored strategy and free consultation.
Get a Free Consultation