
Ready to transform your business with Business Intelligence?
Contact our expert team today for a tailored strategy and free consultation.
Get a Free ConsultationNo services available in this category yet.
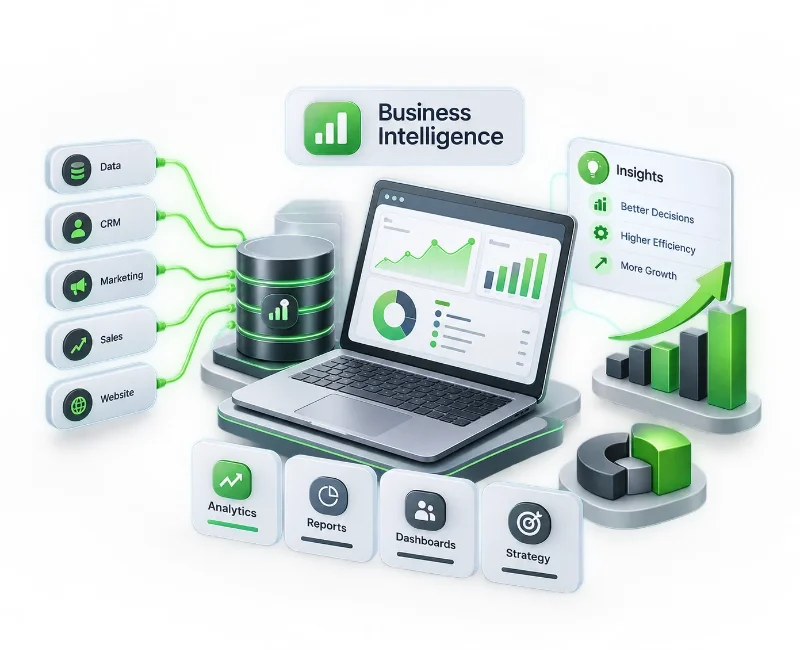
Your business already generates valuable data through sales, marketing, finance, operations, customer interactions and other systems. The challenge is turning that information into a reliable view of what is happening, why it is happening, and where action is needed.
Falconics IT Solutions provides business intelligence services that help businesses organize data, connect relevant sources, create practical dashboards and establish reporting systems built around real business questions.
Whether you need a management dashboard, consolidated reporting environment or a more structured BI system, we focus on making information easier to understand and use.
Consolidate data from relevant business sources
Build dashboards and reports around decision-making needs
Improve visibility across key business functions
Create scalable reporting and analytics workflows
Business intelligence is more than creating attractive dashboards. A useful BI environment needs reliable data, appropriate architecture, meaningful metrics and reporting that people can actually use.
Our approach can cover the BI lifecycle from understanding your data and requirements through implementation, visualization, testing and ongoing optimization.
The exact scope depends on your existing systems, data maturity, business objectives and reporting requirements.
A BI initiative should start with the questions your business needs to answer—not with a dashboard template or a particular software tool.
We assess your reporting requirements, existing data sources and technology environment to help define an appropriate BI direction. This can include identifying useful KPIs, reviewing existing reporting processes, evaluating integration requirements and establishing a practical implementation roadmap.
The outcome is a clearer understanding of what should be built, which data matters and how the BI environment should support your business.
Business information is often distributed across CRM platforms, ERP systems, databases, spreadsheets, ecommerce platforms, marketing tools and other applications.
We help bring relevant information together so it can be analyzed within a consistent reporting environment. Depending on the project, this can involve data extraction, transformation, cleansing, mapping and integration.
The objective is to create a dependable foundation for reporting rather than simply placing disconnected data into a dashboard.
A dashboard should help someone understand a business situation quickly and decide what to do next.
We develop dashboards and reports around the needs of different users, such as management, sales, marketing, finance or operations. Visualizations can be structured around KPIs, trends, comparisons, targets, exceptions and other metrics that matter to the business.
Where appropriate, solutions can be developed using platforms such as Power BI or other suitable visualization technologies based on your existing environment and requirements.
BI becomes more valuable when reporting moves beyond basic numbers and helps explain business performance.
We can structure reporting around areas such as sales performance, customer activity, marketing performance, operational metrics, financial indicators and other business-specific measures.
This gives decision-makers a more consistent way to review performance instead of depending on manually assembled reports from multiple sources.
Some businesses need more than historical reporting. When the underlying data is suitable, BI environments can also support analytical models that help identify patterns, trends and potential future scenarios.
Advanced analytics may be considered for areas such as demand analysis, customer behavior, forecasting or operational planning.
The appropriate approach depends on data availability, quality and the specific business question—not simply on whether an advanced technology can be added.
Business intelligence systems need attention as data sources, reporting requirements and business processes change.
Ongoing support can include dashboard updates, reporting improvements, data-quality checks, performance optimization, troubleshooting and adjustments to accommodate new requirements.
This helps keep the BI environment aligned with the way your business actually operates over time.
The value of business intelligence comes from making important information easier to access, interpret and act upon.
A well-structured BI solution can help your organization:
Replace fragmented reporting with a more consistent view of business information
Reduce dependence on repetitive manual reporting
Give teams faster access to relevant KPIs and performance indicators
Identify trends, anomalies and operational issues more easily
Improve visibility across departments and business functions
Establish clearer reporting processes as the organization grows
We use a practical process that connects business objectives with data and technology rather than treating BI as a purely technical implementation.
We begin by identifying the decisions the BI solution needs to support, the people who will use it, the metrics they need and the limitations of the current reporting environment.
This establishes the purpose of the project before technical implementation begins.
Next, we review relevant data sources, structures, integrations and reporting workflows.
This stage helps identify data-quality issues, duplicated information, missing connections and technical considerations that could affect the final solution.
Based on the requirements and data environment, we define the reporting structure, data flow, dashboard requirements and appropriate technology approach.
The focus is on creating a solution that is useful for current needs while leaving room for future requirements.
Data pipelines, reports and dashboards are developed and connected to the required sources.
Testing focuses on data accuracy, calculations, usability and performance so that the delivered reports provide information users can rely on.
Once the solution is deployed, we review how it performs in the real business environment and identify areas for refinement.
As reporting requirements evolve, dashboards, integrations and analytics can be improved accordingly.
The exact deliverables depend on the scope of your BI project. A typical engagement may include:
BI requirements and reporting assessment
Data-source and integration planning
Data preparation and transformation
KPI and reporting framework
Interactive dashboards and business reports
Data visualization
BI implementation and configuration
Documentation and knowledge transfer
Ongoing maintenance or optimization where required
BI does not have to serve the entire organization in the same way. Different teams may need different views of the same underlying business information.
Management and leadership can use consolidated dashboards to review high-level performance, trends and key indicators.
Sales teams can analyze pipeline activity, revenue performance, customer segments and sales trends.
Marketing teams can bring campaign, channel and conversion information together for clearer performance reporting.
Operations teams can monitor productivity, process performance, inventory or other operational indicators.
Finance teams can organize financial reporting and performance metrics into more accessible management views.
The goal is to create reporting that reflects how each team makes decisions rather than producing generic dashboards that are difficult to use.
Business intelligence can be useful for organizations at different stages of data maturity.
Growing businesses may need to move beyond spreadsheets and manually prepared reports as data volumes increase. Established organizations may need to consolidate information across departments, systems or locations.
BI services can also be relevant to ecommerce businesses, B2B companies, technology businesses, professional service providers and organizations with complex operational or customer data.
The right starting point depends less on company size and more on the complexity of the decisions, data and reporting processes involved.
Many BI projects begin because business information has become difficult to manage rather than because a company simply wants another reporting tool.
Typical challenges include disconnected data sources, inconsistent KPIs, spreadsheet-heavy reporting, limited visibility between departments, repetitive manual reporting and dashboards that do not answer the questions users actually have.
Our role is to connect the business requirement with the appropriate data and technology approach so the resulting BI environment has a clear purpose.
The technology used for a BI project should follow the requirements of the business.
Depending on your existing environment, requirements may involve databases, cloud platforms, APIs, data warehouses, spreadsheets, business applications and visualization tools such as Power BI.
Rather than forcing every project into the same technical stack, the implementation should consider existing infrastructure, data sources, user requirements, scalability and long-term maintainability.
Falconics IT Solutions combines data, technology and business-focused digital capabilities under one service ecosystem. Its wider technology offering includes data analytics, business intelligence, software development, AI and automation, web development and digital growth services.
For BI projects, this broader technical perspective can be useful when reporting requirements connect with existing applications, databases, automation workflows or digital platforms.
The working model emphasizes understanding the business requirement first, building the appropriate solution, measuring how it performs and refining it as requirements change.
Falconics also has an established team of 25+ specialists across its broader digital and technology services, supporting projects that may require expertise beyond reporting and visualization alone.
There is no meaningful one-size-fits-all price for BI implementation because project requirements can vary considerably.
The overall investment can be influenced by factors such as the number and complexity of data sources, data quality, integration requirements, dashboard complexity, number of users, technology choices, security requirements, customization and ongoing support.
After understanding your existing environment and objectives, the project scope can be defined more accurately.
Business intelligence should be treated as a business system rather than a one-time visual reporting exercise.
The quality of the final outcome depends partly on the quality and accessibility of the underlying data, clarity of business requirements, availability of relevant stakeholders and the consistency of the metrics being used.
Meaningful improvements may therefore require more than dashboard development. In some projects, data integration, reporting processes or underlying data structures need attention first.
Business intelligence services help organizations collect, integrate, analyze and visualize business data so decision-makers can work with clearer and more accessible information. Depending on the project, services can include BI consulting, data integration, dashboard development, reporting, analytics, implementation and ongoing support.
The appropriate data depends on the business and its reporting requirements. Sources can include databases, spreadsheets, CRM and ERP systems, ecommerce platforms, APIs, marketing platforms and other business applications.
BI solutions can be designed around an organization's existing technology environment. The feasibility and approach depend on available integrations, data structures, access permissions and the requirements of the proposed solution.
Not necessarily. A BI project may involve improving an existing reporting environment, integrating additional data sources or replacing inefficient processes where there is a clear business or technical reason to do so.
Power BI can be an effective option for organizations that need interactive reporting and data visualization, but the appropriate platform depends on the existing technology environment, reporting requirements, data architecture and user needs.
The timeline varies according to scope. A focused dashboard project with a small number of clean data sources can be substantially different from an enterprise implementation involving multiple systems, complex integrations and extensive data preparation.
Useful inputs can include access to relevant data sources, existing reports, KPI definitions, business requirements, examples of current reporting processes and information about the teams that will use the solution.
Yes. BI solutions can be structured around specific business functions, KPIs, users, data sources and reporting requirements. The objective is to make the reporting environment relevant to the decisions your organization needs to make.
Ongoing support can be included where required. Depending on the engagement, this may cover dashboard changes, troubleshooting, data-quality checks, performance improvements and adjustments to evolving reporting requirements.
Pricing depends on factors including project scope, data complexity, integrations, dashboard requirements, technology, customization, users and ongoing support. A clear assessment of the requirements is needed before defining an appropriate scope and commercial proposal.
Start by sharing your current reporting challenges, data sources, business objectives and the type of information your teams need to access. Falconics IT Solutions can then assess the requirements and determine an appropriate next step.
Your data becomes more valuable when the right people can access the right information at the right time.
Whether you are replacing manual reporting, consolidating multiple data sources or building a more structured analytics environment, Falconics IT Solutions can help define a BI approach around your actual business requirements.
Contact our expert team today for a tailored strategy and free consultation.
Get a Free Consultation